
IntegrityStar, April 2016 edition


Are Reports to the UCF IntegrityLine Really Investigated?

Yes, appropriate action is taken to review and investigate each report that is submitted to the UCF IntegrityLine. Reports received through the UCF IntegrityLine are triaged and based on the nature of the report, they are either investigated by the University Compliance, Ethics, and Risk, University Audit, jointly by both offices, or referred to the appropriate compliance partner. When we receive reports involving students, we refer those to the Office of Student Rights and Responsibilities. The IntegrityLine launched on September 29, 2014, and received a total of 72 reports the first year. Below is additional information you might find interesting about the reports received.


Intake Method

More than half of the reports came in through the IntegrityLine website, with the remaining either through the IntegrityLine telephone number or by making direct contact with our office.
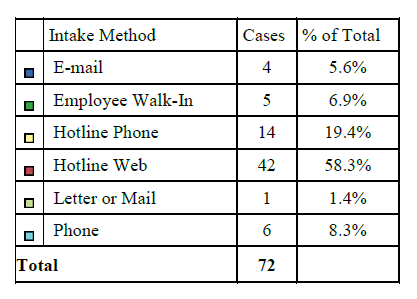
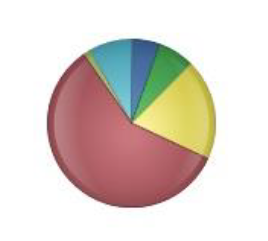
Snapshot of the Intake Method Table: 
1. Intake Method: Email, Cases: 4, % of Total: 5.6% 
2. Intake Method: Employee Walk-In, Cases: 5, % of Total: 6.9% 
3. Intake Method: Hotline Phone, Cases: 14, % of Total: 19.4% 
4. Intake Method: Hotline Web, Cases: 42, % of Total: 58.3% 
5. Intake Method: Letter or Mail, Cases: 1, % of Total: 1.4% 
6. Intake Method: Phone, Cases: 6, % of Total: 8.3% Total: 72   Screenshot of the Intake Method Pie Chart generated from the image of the table on the left.


Source of Awareness

Of the 72 cases received, only 69 individuals reported the source of how they became aware of the misconduct. Approximately one-third of these individuals reported that the misconduct happened to them. The remaining were brought forward by individuals who either observed it, overheard or received the information secondhand, or found a document or file that revealed the issue.
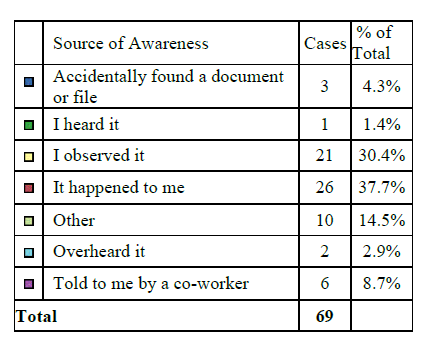
Snapshot of the Source of Awareness Table: 
1. Source of Awareness: Accidentally found a document or file, Cases: 3, % of Total: 4.3% 
2. Source of Awareness: I heard it, Cases: 1, % of Total: 1.4% 
3. Source of Awareness: I observed it, Cases: 21, % of Total: 30.4% 
4. Source of Awareness: It happened to me, Cases: 26, % of Total: 37.7% 
5. Source of Awareness: Other, Cases: 10, % of Total: 14.5% 
6. Source of Awareness: Overheard it, Cases: 2, % of Total: 2.9% 
7. Source of Awareness: Told to me by a co-worker, Cases: 6, % of Total: 8.7% Total: 69   Screenshot of the Source of Awareness Pie Chart generated from the image of the table on the left.


Anonymous Reporting

The majority of individuals submitting a report chose to remain anonymous; however, one-third felt comfortable sharing their identities.
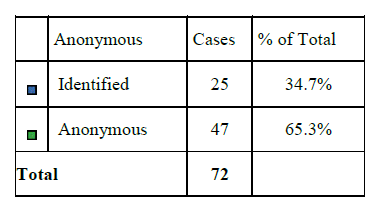
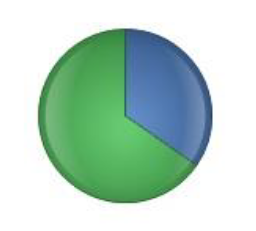
Snapshot of the Anonymous Reporting Table: 
1. Anonymous: Identified, Cases: 25, % of Total: 34.7% 
2. Anonymous: Anonymous, Cases: 47, % of Total: 65.3% 
Total: 72   Screenshot of the Anonymous Reporting Pie Chart generated from the image of the table on the left.


Issue Type

The types of issues reported span a range of more than 20 specific topics including financial, safety, and human resources related issues.
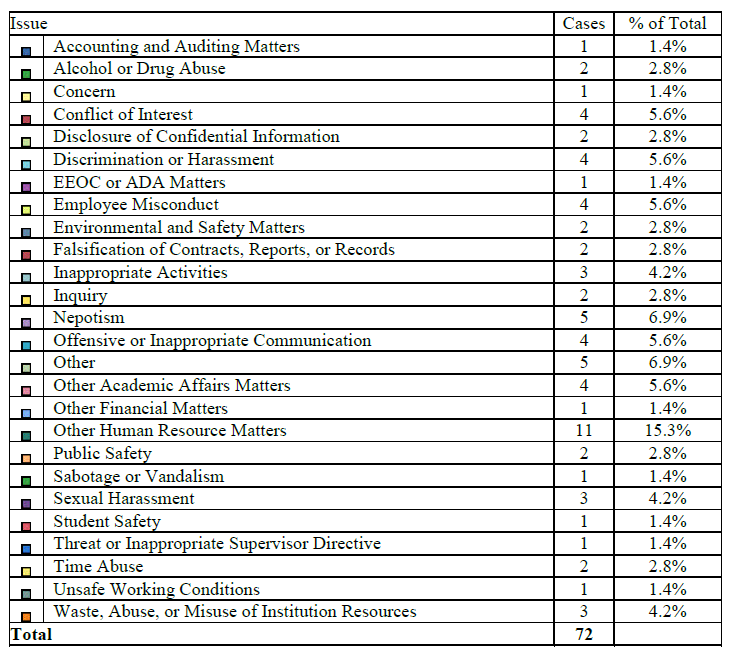
Snapshot of the Issue Type Table: 
1. Issue: Accounting and Auditing Matters, Cases: 1, % of Total: 1.4% 
2. Issue: Alcohol or Drug Abuse, Cases: 2, % of Total: 2.8% 
3. Issue: Concern, Cases: 1, % of Total: 1.4% 
4. Issue: Conflict of Interest, Cases: 4, % of Total: 5.6% 
5. Issue: Disclosure of Confidential Information, Cases: 2, % of Total: 2.8% 
6. Issue: Discrimination or Harassment, Cases: 4, % of Total: 5.6% 
7. Issue: EEOC or ADA Matters, Cases: 1, % of Total: 1.4% 
8. Issue: Employee Misconduct, Cases: 4, % of Total: 5.6% 
9. Issue: Environmental and Safety Matters, Cases: 2, % of Total: 2.8% 
10. Issue: Falsification of Contracts, Reports, or Records, Cases: 2, % of Total: 2.8% 
11. Issue: Inappropriate Activities, Cases: 3, % of Total: 4.2% 
12. Issue: Inquiry, Cases: 2, % of Total: 2.8%
13. Issue: Nepotism, Cases: 5, % of Total: 6.9% 
14. Issue: Offensive or Inappropriate Communication, Cases: 4, % of Total: 5.6% 15. Issue: Other, Cases: 5, % of Total: 6.9% 
16. Issue: Other Academic Affairs Matters, Cases: 4, % of Total: 5.6% 
17. Issue: Other Financial Matters, Cases: 1, % of Total: 1.4% 
18. Issue: Other Human Resource Matters, Cases: 11, % of Total: 15.3% 
19. Issue: Public Safety, Cases: 2, % of Total: 2.8% 
20. Issue: Sabotage or Vandalism, Cases: 1, % of Total: 1.4% 
21. Issue: Sexual Harassment, Cases: 3, % of Total: 4.2% 
22. Issue: Student Safety, Cases: 1, % of Total: 1.4% 
23. Issue: Threat or Inappropriate Supervisor Directive, Cases: 1, % of Total: 1.4% 
24. Issue: Time Abuse, Cases: 2, % of Total: 2.8% 
25. Issue: Unsafe Working Conditions, Cases: 1, % of Total: 1.4% 
26. Issue: Waste, Abuse, or Misuse of Institution Resources, Cases: 3, % of Total: 4.2% 
Total: 72
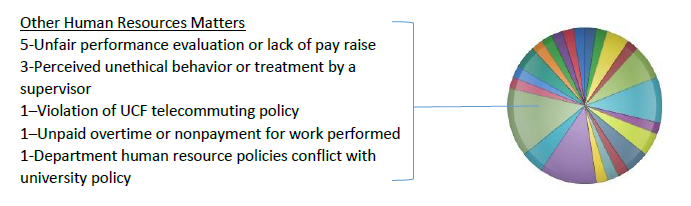
An image of the Issue Type Pie Chart represented by the information from the table above as well as the following information: 
Other Human Resources Matters
5-Unfair performance evaluation or lack of pay raise 
3-Perceived unethical behavior or treatment by a supervisor 
1-Violation of UCF telecommuting policy 
1-Unpaid overtime or nonpayment for work performed 
1-Department human resource policies conflict with university policy


UCF IntegrityLine Closed Cases

We reviewed, investigated as necessary, and closed 53 of the 72 cases we received. The following are case outcomes for the closed cases:
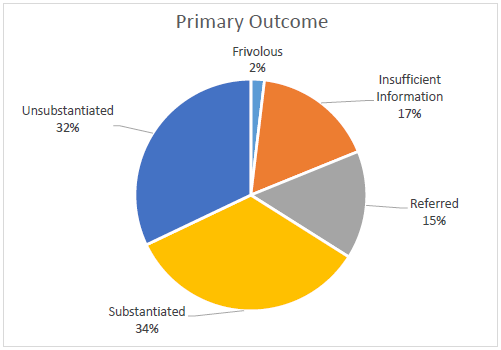
Image of the Primary Outcome Pie Chart from the data below.
Frivolous: 2% 
Unsubstantiated: 32% 
Insufficient Information: 17% 
Referred: 15% 
Substantiated: 34%


Frivolous. We reviewed one frivolous case that appeared on the surface as a legitimate complaint. After collaborating with the Equal Opportunity and Affirmative Action office to fact check the allegations, we jointly determined that the complaint was not legitimate and closed it.

Insufficient Information. We closed nine cases due to insufficient information. These were cases where the reporter gave very little information. Upon receiving these complaints, we posted questions to the reporter, and they never responded.

Referred. We referred eight cases to our compliance partners in the police department and the office of student conduct, as the cases were more appropriate for them to handle through another university process.

 Investigated Cases

We investigated the remaining 35 cases, which resulted in 18 substantiated and 17 unsubstantiated outcomes.

  • The 18 substantiated investigations yielded enough evidence to support the complaint and a finding that misconduct occurred. These cases required action by the university.
  • The 17 unsubstantiated investigations yielded insufficient or no evidence to support that misconduct occurred. For unsubstantiated cases, we still may make recommendations for improvements in a policy, process, or training if we identify weaknesses during our investigation.